
Part 9 of the Transforming Instruction Through Technology series. This article explains how using Piktochart can develop ELs’ engagement with content, cultivate critical thinking, and promote the authentic use of language.
From Past-Century to Modern Learning
A certain 6th grade history teacher at my school wanted his students to create a poster to demonstrate their understanding of the content in the Ancient Civilization units, specifically on Mesopotamia. This assignment developed students’ critical thinking skills by requiring them to synthesis information, organize ideas, and analyze the most relevant information to include in the poster.
This assignment would have been great for a classroom in the 1950s – but not in 2017.
If you were in a board meeting and someone whipped out a poster adorned with glitter, bejeweled with beads, and dotted with hot-glued trinkets, how seriously would you take the presenter? Now image a presenter sharing a computer generated infographic. How much more attentive would you be when listening to that presenter?
Marc R. Prensky wrote that, “Today’s teachers need to be sure that, no matter what subjects they are teaching, they are teaching them with the future in mind” (2010, p. 5). Piktochart provides a platform to bring the future into our classrooms.
Sadly, this history teacher wanted students to create a physical poster only so that it could be hung in the room for other students to view. Despite me presenting the reasons for creating a digital infographic, he only allowed ELs to use the program. This teacher’s resistance sandbagged the non-ELs into completing a limited arts and craft activity. He willingly traded the audience as big as the world for the four walls of his classroom.
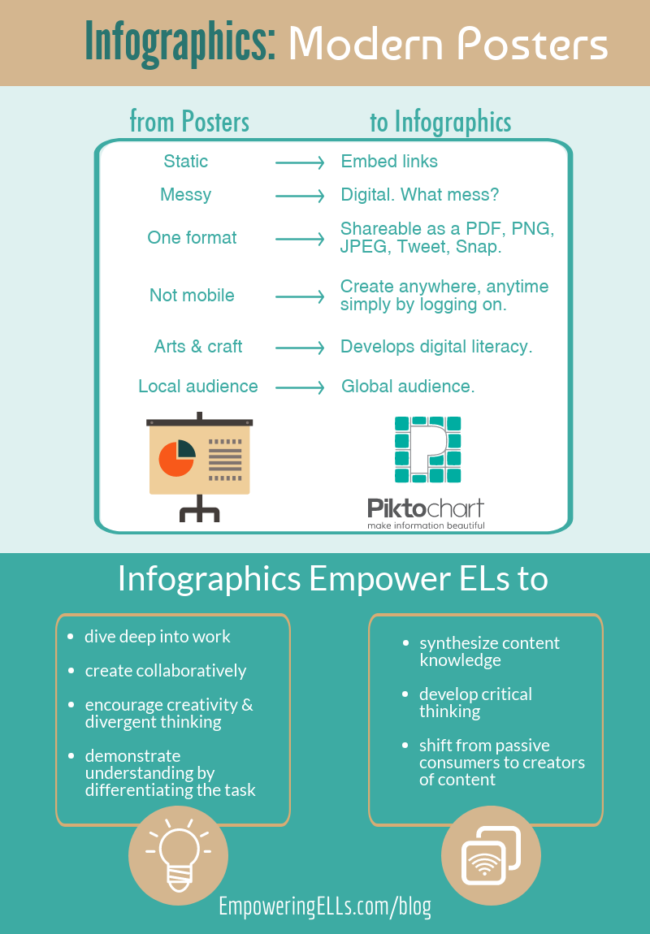
Tech bridges the divide between our classrooms and the world.A Robust Tool for Learning Content and Using Language
When we break down the word “infographic”, we get “information” and “graphics”. Therefore, infographics are displays that should be effective at communicating information using visuals. Content teachers should be excited about the benefits of infographics because they will help them assess ELs’ understanding even if they are beginners to the language.
English language teachers also love infographics because they provide an alternative to writing extended texts while still fulfilling the requirement to produce some text that demonstrates understanding. With a free account on Piktochart, ELs are given several templates that can jumpstart their infographics. Students can plug their ideas straight in. To their credit, none of my ELs chose the templates. Instead, they tapped into their deep wells of creativity to create using a blank canvas.
There’s no need to purchase a Piktochart account, but because Piktochart loves educators, they do offer a significant discount if you choose to do so. For $45, teachers get the pro-level package valued at $239. Students can sign up for free, which is what I have my ELs do.
And no, I’m not getting paid by Piktochart for this post.
Creating with Infographics
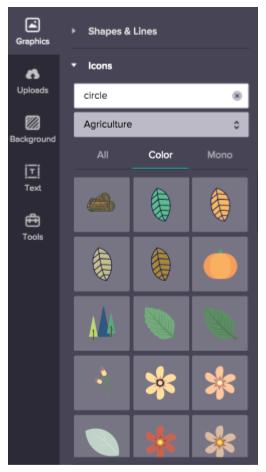
Piktochart gives users a wealth of icons that help students communicate their ideas. My EL students evaluated which icons were the most relevant to their infographics and added texts to provide meaning. Both the color and size of the icons and texts can be manipulated for added effect.
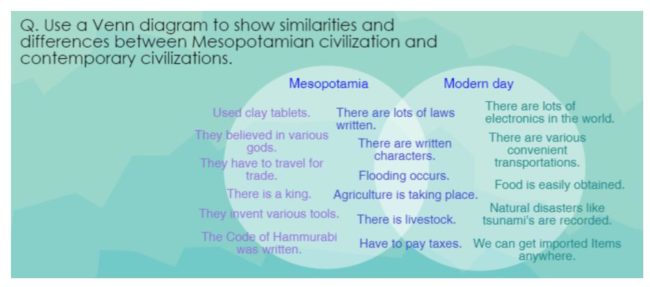
For example, the assignment required students to create a Venn Diagram to compare the differences between the Mesopotamian civilization and the students’ respective cultures. They used the circle icon, adjusted its transparency, and added texts to complete the Venn Diagram.
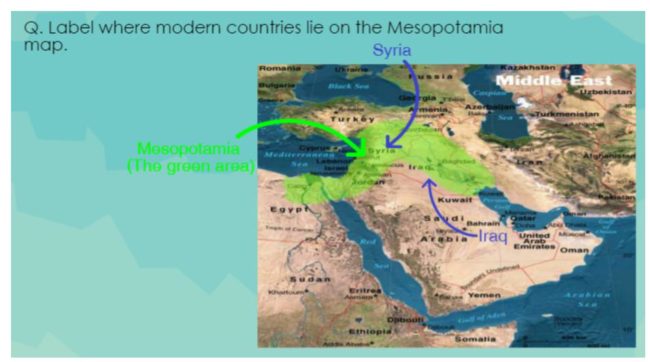
Furthermore, Piktochart allows students to upload images they found from the web. For this project, they needed a map that identified the current countries that used makeup Mesopotamia. The ELs had an additional option of importing maps within Piktochart’s Map function, which allows for maps to be manipulated and labeled.
In addition to fostering ELs’ critical thinking skills, creating infographics developed their literacy skills and stimulated engagement with the content. The infographics required that students return to their texts to reread information related to Mesopotamia. Students had to evaluate the most relevant details to include into their infographics. They also had to write texts to construct meaning for the readers.
Do you remember Ayaka – the Entering EL from Japan? This is her infographic for the Mesopotamia project. Though she was non-verbal at this phase of her English development, she still could participate in the activity using Piktochart.
From Arts & Crafts to Digital Content
In their book entitled ELL Frontiers: Using Technology to Enhance Instruction for English Learners, Parris, Estrada, and Honigsfeld write that, “A digital learning environment provides opportunities to engage in the learning process and gain essential digital and informational literacy skills needed for real-life situations” (2016, Kindle location, 342).
If this history teacher was more receptive, I would have suggested making this project more authentic by connecting the infographic to a real-life situation:
In May of 2015, ISIS took over the ancient Roman oasis city of Palmyra in Syria, which used to be part of the Mesopotamian civilization. ISIS started destroying the ancient ruins of the amphitheater, considered a World Heritage Site. I wanted to suggest that students create an infographic campaign to save the remaining ruins in Syria.
Students would research reasons why ancient ruins were important to preserve, and with Piktochart’s collaboration function, teams of students would create infographics that communicated the importance of these ancient ruins.
We would then send the infographics to the students’ respective ambassadors residing in Laos to see what channels these infographics could be spread. Additionally, we could have Tweeted the infographics, pinned them on Pinterest, and started a Facebook Page devoted to stopping the destruction.
They would have showed the synthesis of information they had learned from their Mesopotamian unit, as the history teacher wanted, while applying that knowledge to something real and important in the present day – making it much more likely they would connect to the information and the assignment. Though I am being highly critical of this teacher, there is a weakness of infographics – they are not tactile. Some students might benefit from the tactile nature of making physical posters.
Takeaways
This project would have captivated students’ attention because the work was connected to a real problem. With the aid of technology, they could have been empowered to be real-life problem solvers.
Enhancing teaching isn’t enough! Tech needs to empower ELs to be creators and problem solvers.
With programs like Piktochart, Adobe Spark, and Buncee, teachers kill three birds – not two – with one stone. They:
- foster engagement with content,
- encourage ELs to use language instead of memorizing it
- and cultivate critical thinking skills necessary for college and careers.
Parris, H., Estrada, L., & Honigsfeld, A. M. (2016). ELL frontiers: Using technology to enhance instruction for English learners. Thousand Oaks, CA: Corwin.
Prensky, M. (2010). Teaching digital natives: Partnering for real learning. Thousand Oaks, CA: Corwin.